If you’re preparing for the United States Medical Licensing Examination® (USMLE®) Step 1 exam, you might want to know which questions are most often missed by test-prep takers. Check out this example from Kaplan Medical, and read an expert explanation of the answer. Also check out all posts in this series.
The AMA and Kaplan have teamed up to support you in reaching your goal of passing the USMLE® or COMLEX-USA®. If you're looking for additional resources, Kaplan provides free access to tools for pre-clinical studies, including Kaplan’s Lecture Notes series, Integrated Vignettes, Shelf Prep and more.
This month’s stumper
A particular association determines membership on the basis of members' IQ scores. Only those persons who have documented IQ scores at least two standard deviations above the mean on the Wechsler Adult Intelligence Scale (WAIS) are eligible for admission.
Of a group of 200 people randomly selected from the population at large, how many would be expected to be eligible for membership to this society assuming a normal IQ distribution?
A. Two.
B. Five.
C. Seven.
D. Nine.
E. 12.
The correct answer is B.
Kaplan Medical explains why
In a normal distribution or bell-shaped curve, the mean, median, and mode are equal and at the center of the curve.
- Mean (synonym for average): the sum of the values of the observations divided by the number of observations.
- Median: the point on a scale that divides the group into an upper and lower half. The measurement below which half the observations fall is the 50th percentile.
- Mode: the most frequently occurring value in a set of observations.
The standard deviation (SD) is a measure of the spread of numbers in a set of data from its mean value.
- One SD above and below the mean: contains 68% of the population.
- Two SDs above and below the mean: contains about 95% of the population. About 2.5% of the population will be two SDs above the mean and about 2.5% of the population will be two SDs below the mean.
The graph below depicts a normal distribution with 1, 2 and 3 standard deviations of the mean:
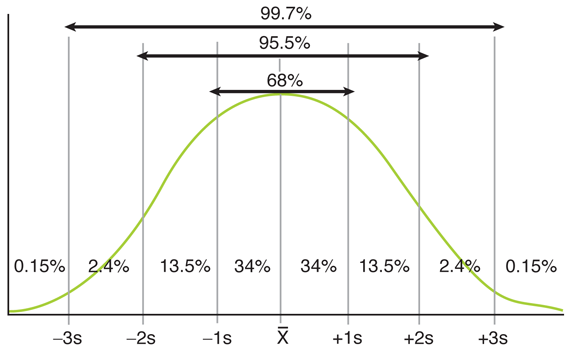
Applying these concepts to this scenario: 95% of IQs in a normally distributed population will fall between plus or minus 1.96 (round up to two) standard deviations from the mean. Since the population is normally distributed with regard to IQ, this means that approximately 2.5% of the population will have IQ scores two standard deviations or more above the mean, and 2.5% of the population will have IQ scores two standard deviations or more below the mean. Therefore, 2.5% of 200 people is five people.
Tips to remember
In any normal curve:
- 68% falls within one standard deviation of the mean.
- 95.5% falls within two standard deviations of the mean.
- 99.7% falls within three standard deviations of the mean.
For more prep questions on USMLE Steps 1, 2 and 3, view other posts in this series.